Node.js
Python
General
Application metrics
Memory usage
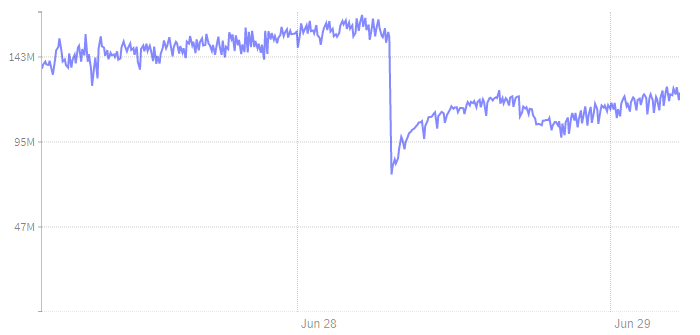
Memory usage chart shows current and historical memory usage of all your application processes combined. The chart helps you reveal patterns in memory usage, detect memory leaks or make a decision about plan upgrade if you're close to hitting the memory limit available in your plan.
CPU utilization
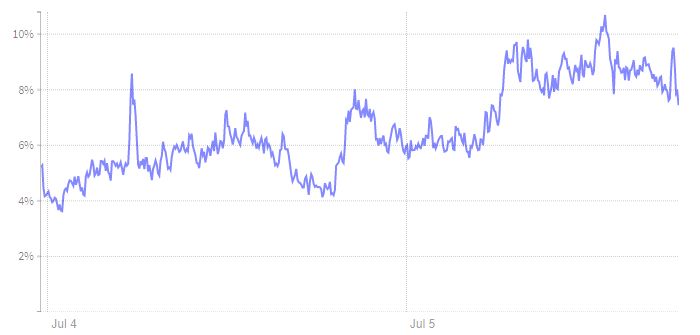
CPU utilization chart shows current and historical cpu usage of all your application processes combined. The CPU usage is displayed as a percentage of the available CPU power utilized by your application.
100% utilization means that your application is using 100% of the available CPU power.
20% utilization means your app still has 80% of CPU power available.
If you're hitting 100% CPU utilization, your app is using all of its available CPU resources and performance may be degraded. You should consider upgrading your plan or switching to a plan with a dedicated server option which offers more CPU power.
Response time
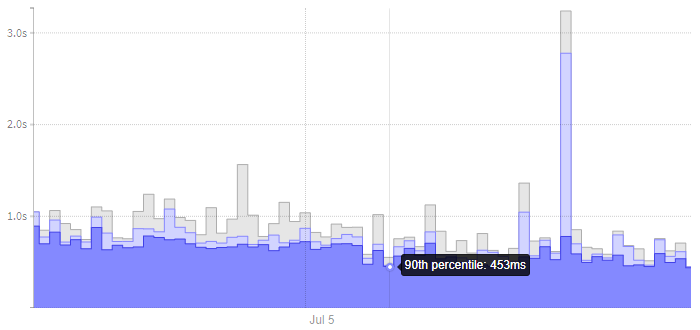
Response time chart shows current and historical response time percentiles for your application. Response time metric represents the time it took your app to process a request and return a response. It does not include the time it took a browser to send and receive a response on client side. It's a server-side metric which reflects how quickly your app can respond to requests.
There are three percentile metrics:
- 90th percentile: The value represents maximum response time within which 90% of requests were completed. 10% of requests were completed in more time than this value.
- 95th percentile: The value represents maximum response time within which 95% of requests were completed. 5% of requests were completed in more time than this value.
- 99th percentile: The value represents maximum response time within which 99% of requests were completed. 1% of requests were completed in more time than this value.
As an example – if 95th percentile shows a value of 150ms it means 95% of requests were completed within less time than 150ms and 5% requests took more than 150ms to complete.
Please note: if your application uses websockets you may see response times in minutes even hours or days. This is normal and expected behavior. Response time tracks the total time it took to process a request until the connection is closed. Since websockets are long-lived connections, they may be opened for days and will be shown as days in the response time chart.
Throughput
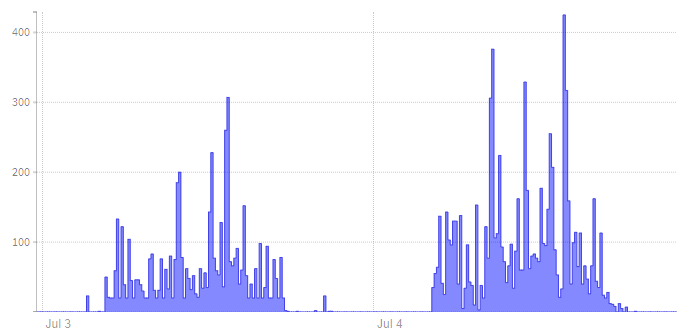
Throughput chart shows current and historical number of requests served by your application. The value represents a number of HTTP requests that your application served within a given timeframe.